About LLNL Weather
Why we collect meteorological data
Compliance with laws
Meteorological data collected at LLNL are used to demonstrate compliance with federal, state, and local laws, regulations, and orders. DOE directives require LLNL to collect sufficient meteorological data to assess the impact of hazardous material releases on the environment and the public. On-site meteorological monitoring is required to accurately assess the transport and diffusion of airborne materials and the impacts of planned and unplanned airborne releases on public health. In addition, DOE sites are required to have on-site programs that can provide data used to perform the required dose calculations specified in 40 CFR Part 61, Subpart H, National Emission Standards for Hazardous Air Pollutants; Standards for Radionuclides, which states:
Compliance with this standard shall be determined by calculating the highest effective dose equivalent to any member of the public at any offsite point where there is a residence, school, business, or office.
Required dispersion models
The U.S. EPA requires the use of mandated computer models to demonstrate compliance with 40 CFR Part 61, Subpart H. LLNLs primary calculation tool for the estimation of dose and risk is the computer model CAP88-PC, developed by U.S. EPAs Office of Radiation Programs (Parks 1992). The meteorological input to CAP88-PC consists of a joint-frequency distribution of wind direction and atmospheric stability, average wind speed for each combination of wind direction and stability, average mixing-layer depth, annual average temperature, and annual rainfall.
DOE Orders
DOE Order 458.1 Radiation Protection of the Public and the Environment and DOE-HDBK-1216-2015 Environmental Radiological Effluent Monitoring and Environmental Surveillance require each DOE site to have a meteorological program that is appropriate to the sites activities, topography, and distance to critical receptors. DOE requires that meteorological measurements must be representative of the conditions that determine transport and dispersion at the site. Furthermore, real-time meteorological data should be available to assess adequately, in accord with DOE Order 151.1C, the actual or potential on-site and off-site consequences of an emergency. Meteorological information can also be used to assess potential consequences of radiological releases from projected new or modified facilities, as well as consequences of actual accidental radiological releases. Livermore Site and Site 300 are both NARAC (National Atmospheric Release Advisory Center) sites as designated by DOE. NARAC was developed at LLNL to provide real-time assessments of the impact of radiological releases to the atmosphere anywhere in the world.
Offsite data is inappropriate
Off-site meteorological data, such as the data collected at National Weather Services (NWS) stations, may be used if the meteorological conditions at the station are similar to on-site conditions. The nearest NWS stations are at the the Livermore Airport, the Hayward Air Terminal, Oakland Airport, and Stockton, but meteorological conditions at these locations do not accurately represent dispersion conditions at the Livermore site or Site 300. Moreover, it may be difficult to retrieve data from off-site meteorological stations in a timely manner during emergencies. For these reasons, among others, on-site meteorological monitoring systems are employed.
Use of meteorological data for site planning
DOE Order 420.1B sets the requirements for evaluating facility safety, including the assessment of hazards posed by natural phenomena such as flood, wind and lightning. Temperature and humidity data can be used to plan efficient air conditioning and space heating of proposed facilities. Hood exhaust re-entrainment and building-wake effects can be modeled using wind-flow data provided by on-site monitoring. Facility designers should use meteorological data when proposing stacks and cooling towers. U.S. EPA guidance for stack design can be found in the Guideline for Determination of Good Engineering Practice Stack Height (U.S. EPA 1985 EPA Publication No. EPA450/480023R).
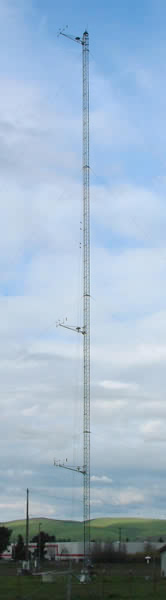
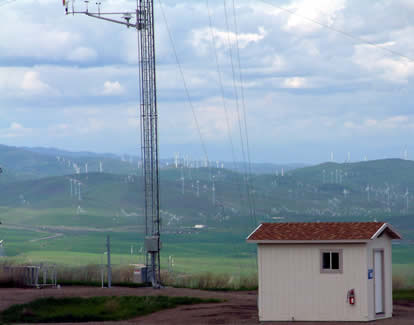
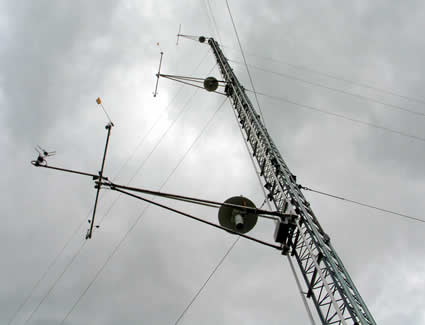
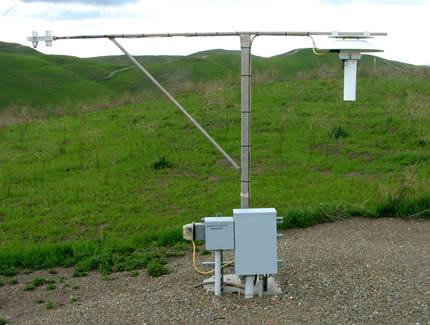
Instruments at 10m
Other uses for LLNLs meteorological data
LLNLs meteorological data has become a site-wide and regional resource. Some LLNL projects that have used this data include:
- Fire fighting operations
- Controlled burn planning at Site 300
- To estimate/predict worker heat stress and recommend work/rest regimens (Hazards Control)
- To support ground water remediation and sub-surface modeling (Environmental Restoration Department)
- Compliance with local and regional operating permits (ERD & EFA)
- Security investigations
- Determination of wind loading for NIF
- Design parameters for the Contained Firing Facility
- Wind safety for construction projects
- Determination of cooling and heating requirements for buildings
- Energy management for cooling and heating of buildings
- Estimation of electrical load for the site and individual buildings
- Emergency management
- Dispersion modeling (NARAC)
- Transportation safety analysis
- Experiment support
- LLNL Web portal
- Regional climate studies
- Development of regional air flow models (Bay Area Air Quality Management District)
- Zone 7 Water Agency
- Local landfills
- University sponsored water balance modeling of soils
- Investigations related to regional chemical releases
- PM 2.5 (Fine Particulate Matter) studies
- Yale University hydrology studies
- Seasonal weather studies by regional businesses
- Solar power requirements and calibration
Guidance from EPA
On-Site Meteorological Program Guidance
All uses of the meteorological database must comply with EPA guidance established in Guideline for Fluid Modeling of Atmospheric Diffusion (U.S. EPA 1981), Ambient Air Monitoring Guidelines for Prevention of Significant Deterioration (U.S. EPA 1987a), On-Site Meteorological Program Guidance for Regulatory Modeling Applications (U.S. EPA 1987c) and Meteorological Monitoring Guidance for Regulatory Modeling Applications (U. S. EPA 2000).
Volume 4—Meteorological Measurements
LLNL also maintains a quality assurance program that meets the performance requirements described by EPA and DOE. Volume IV of EPAs Quality Assurance Handbook for Air Pollution Measurement Systems, Version 2 (U.S. EPA 2008), commonly called Volume 4, provides guidance for making judgments about the validity of meteorological data and accuracy of meteorological measurement systems.
Guideline on Air Quality Models
Atmospheric dispersion calculations range in complexity from very simple analytical expressions, requiring little or no meteorological data, to complex super-computer models that can accept extensive data sets. The EPA Guideline on Air Quality Models (U.S. EPA Revised 2005) describes its preferred computer models. Another good source is the Handbook on Atmospheric Diffusion (Hanna, Briggs, and Hosker 1982). The dispersion model should be appropriate for the site and application. The assumptions upon which a dispersion model is based should be reasonable, completely documented, and scientifically defensible. The dispersion model should be realistic and yet yield conservative predictions. The data used in these models should be based on data from the appropriate time period. For example, if a proposed experiment has the potential for a release during the daytime, then the probability tables and wind roses that are to be used with the model should include meteorological data taken exclusively during the daytime.
Who is responsible for the meteorological systems
The Water, Air, Monitoring and Analysis Group (WAMA) is responsible for monitoring the effects of operations conducted at the LLNL Livermore site and Site 300 on the environment and the public. Meteorological monitoring represents one aspect of WAMA's monitoring responsibilities.
WAMA has responsibility for the maintenance and calibration of the Livermore site and Site 300 towers. WAMA is responsible for the removal, calibration, refurbishment, and certification of the sensors. Sensor maintenance/replacement/calibration is performed as necessary based on the results of weekly inspections. Wind speed, wind direction, temperature and relative humidity sensors are calibrated and replaced annually as required by DOE-HDBK-1216-2015. Maintenance and calibration is performed by qualified and trained personnel in WAMA.
Periodic audits of the meteorological systems
Every year the meteorological systems are audited by an independent auditor in accordance with EPA guidance set forth in Volume 4. Audits are a critical component of the Quality Assurance (QA) plan.
What procedures are followed?
In conducting it monitoring programs, WAMA writes and follows documented procedures. Two procedures pertain directly to the meteorological systems:
EMP-M-MCA: This procedure describes the equipment and methods used to collect meteorological data at Lawrence Livermore National Laboratory (LLNL) in compliance with the U.S. Department of Energy (DOE) Order 450.1A. This procedure also describes the process used to ensure that meteorological monitoring equipment is maintained and calibrated in accordance with DOE-HDBK-1216-2015. There are also two detailed instructions on performing weekly physical inspections, weekly maintenance, and sensor exchanges.
EMP-M-D: This procedure describes methods used to manage meteorological data collected by the meteorological monitoring stations at the Lawrence Livermore National Laboratory (LLNL) Livermore site and Site 300. This procedure describes the process used to ensure meteorological data is processed in accordance with DOE-HDBK-1216-2015. There are three documented instructions that also support meteorological data management. These instructions cover preparation of monthly reports, preparation of annual reports, and preparation of graphical wind roses.
Livermore Climate
The climate of the Livermore Valley can be characterized as having mild, rainy winters and warm, dry summers. The mean annual temperature is about 15°C. Temperatures range from -5°C during some pre-dawn mornings in the winter, to 40°C in a few summer afternoons. Annual wind rose for the Livermore site is given in Figure 1.
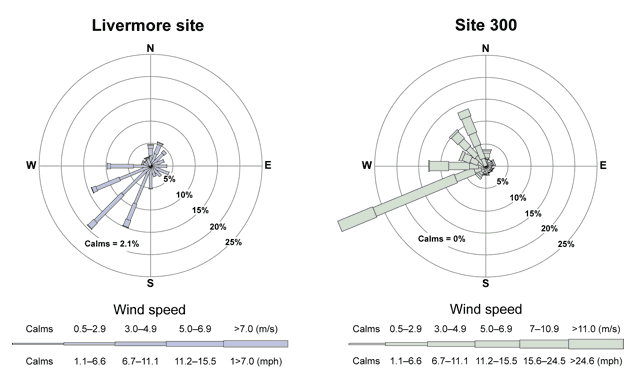
The length of each spoke is proportional to the frequency at which the wind blows from the indicated direction. Different line widths of each spoke represent wind speed classes. The average wind speed in 2007 at the Livermore site was 2.5 m/s (5.6 mph); at Site 300 it was 6.4 m/s (14.4 mph).
It can be seen from this data that the prevailing wind direction is from the southwest. This is the predominant wind direction during the summer. The wind does blow from the northeast and this is primarily during the winter.
Most of the precipitation occurs between October an April with very little rainfall during the summer months. The highest and lowest annual rainfalls on record for the city of Livermore are 812 and 122 mm (31.95 and 4.82 inches). The average annual rainfall is 368 mm (14.48 inches) based on 127 years of data.
Livermores climatology has been described in two documents:
- Climatology of Lawrence Livermore National Laboratory, UCID-21686, by Frank Gouveia (1989) Download PDF (19 MB)
- 1958-2006 Precipitation Climatology for Lawrence Livermore National Laboratory Livermore Site and Site 300, UCRL-TR-228582, by Brent Bowen (2006).
Site 300
The climate at Site 300 is similar to that of the Livermore site. The afternoon temperatures during the summer are typically less than the Livermore site due to higher winds at Site 300. The complex topography of the site significantly influences local wind and temperature patterns. Annual wind rose is presented in Figure 1.
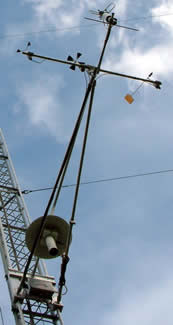
Livermore Site & Site 300 Instruments
The following table lists the instruments on the meteorological towers at the Livermore site and at Site 300. Currently, the towers have the same instruments at the same levels.
| Measurement Height | Sensor Manufacturer and Model | Measures |
|---|---|---|
| 52 meters | Met One 010C | Horizontal Wind Speed |
| Met One 020C | Horizontal Wind Dir | |
| RM Young 27106T | Vertical Wind Speed | |
| Met One 060A-1 | Temperature | |
| 23 meters | Met One 010C | Horizontal Wind Speed |
| Met One 020C | Horizontal Wind Dir | |
| RM Young 27106T | Vertical Wind Speed | |
| Met One 060A-1 | Temperature | |
| 10 meters | Met One 010C | Horizontal Wind Speed |
| Met One 020C | Horizontal Wind Dir | |
| RM Young 27106T | Vertical Wind Speed | |
| Met One 060A-1 | Temperature | |
| Vaisala HMP45 | Temperature Relative Humidity |
|
| RM Young 81000 (Sonic) | Horizontal Wind Component—U Horizontal Wind Component—V Vertical Wind Component—W Sonic Temperature |
|
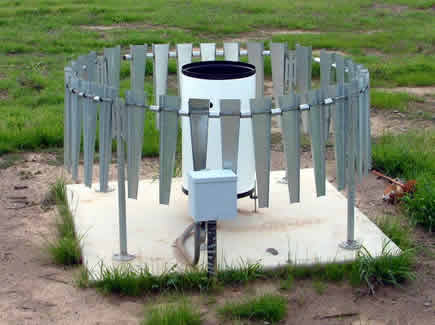
| 2 meters | Met One 060A-1 | Temperature |
| Vaisala HMP45 | Temperature Relative Humidity |
|
| Kipp & Zonen CNR 1 | Solar Radiation - Incoming Solar Radiation - Reflected Infrared Radiation - Incoming Infrared Radiation - Reflected Net Radiation |
|
| Druck RPT410F-3143 (Livermore) Vaisala PTB101C (Site 300) |
Barometric Pressure | |
| Ground | Nova Lynx 260-2500-12 | Rain |
| Campbell Scientific CS616-L Water Content Reflectometer | Soil Moisture | |
| Campbell Scientific TCAV-L Averaging Soil Thermocouple Probe | Soil Temperature | |
| Campbell Scientific HFT3-L | Soil Heat Flux—West Plate Soil Heat Flux—East Plate |
|
| Campbell Scientific CR5000 DCP | Date / Time |
| UCRL-MI-125279 | Privacy & Legal Notice | Comments and suggestions: wegrecki2@llnl.gov | |
| Lawrence Livermore National Laboratory 7000 East Avenue • Livermore, CA 94550 |
Operated by Lawrence Livermore National Security, LLC, for the Department of Energy's National Nuclear Security Administration Learn about the Department of Energy's Vulnerability Disclosure Program |
|